A data-backed model for chronic disease care: 3 years of progress with Community Health Systems and Cadence
The American healthcare system is facing a defining challenge: how to care for millions of aging patients living with complex, chronic conditions, many of whom live far from the specialists and support systems they need. While most virtual care programs still talk about potential, Community Health Systems (CHS) and Cadence have been quietly building one of the first large-scale chronic care programs with three full years of outcomes, and the data proves it works.
Since 2021, CHS and Cadence have partnered to deliver 24/7, at-home support to more than 30,000 patients with hypertension, heart failure, and type 2 diabetes through their program Care Management at Home. This is a reimagined care delivery system designed to keep tens of thousands of patients healthier and out of the hospital.
Now entering its fourth year, the program is delivering clear impact across three critical dimensions: engagement, access, and clinical outcomes.
For Kathy Miller, a 67-year-old Care Management at Home patient in Foley, Alabama, daily monitoring and support through Cadence has been a lifeline.
A new standard for engagement
Patients enrolled in the CHS program are highly engaged, with 78% still active after six months. In 2024 alone, the typical patient:
- Took 355 vitals
- Scheduled 3 or more Cadence Care Team visits between in-person provider visits, spending on average 44 minutes with Cadence clinicians
- And when patients needed help most – nights, weekends, holidays – the Cadence team was there, responding to more than 17,000 off-hours alerts
Leading the nation in chronic disease outcomes
These results reflect not just engagement, but sustained improvements across major chronic conditions:
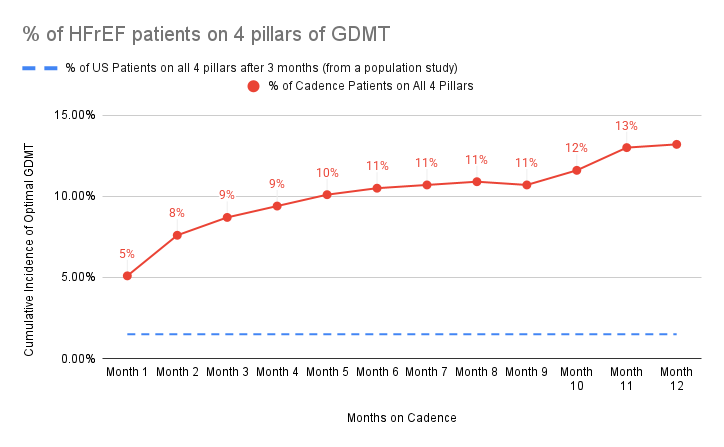
Heart Failure (n=2,028)
- Doubled the rate of patients on all four pillars of guideline-directed medical therapy (GDMT) after 6 months in the program
- These results are dramatically better than usual care – peer-reviewed literature shows that the proportion of patients on optimal GDMT is generally observed to be low (1.5% or below 3 months after discharge)
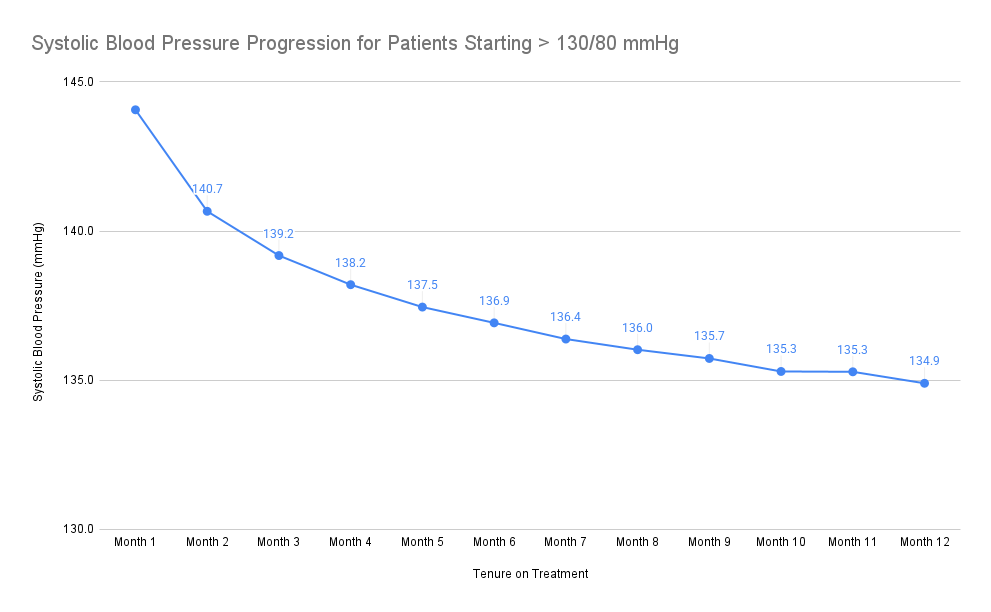
Hypertension (n=11,940)
- 38% more patients reached their blood pressure goal after 6 months in the program
- Patients starting above 130/80 saw a 9 mmHg systolic and 5 mmHg diastolic reduction – enough to reduce risk of major cardiovascular events by ~10% according to the peer-reviewed literature
- 86% of patients with near-goal blood pressure maintained tighter control and reduced volatility, minimizing risk of exacerbations
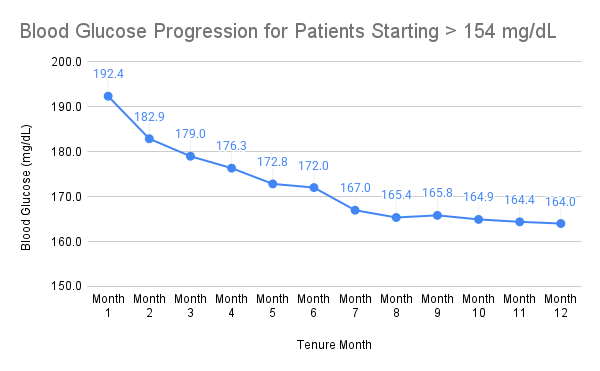
Type 2 Diabetes (n=1,553)
- 9% more patients reached their blood glucose goal (<=154 mg/dL) after 6 months in the program
- Those starting above 154 mg/dL saw an average reduction of 28.3 mg/dL, translating to a meaningful drop in A1c and risk of complications
“This is what proactive care looks like at scale,” said Chris Altchek, CEO and Founder of Cadence. “By deeply integrating with CHS and supporting clinicians with AI-assisted tools and a dedicated virtual Care Team, we’re showing what’s possible when health systems invest in consistent, at-home care. It’s a blueprint for the future of chronic disease management.”
###
Notes on analysis:
- This analysis was conducted on March 19, 2025.
- It includes patients who were in the Care Management at Home/Cadence program for at least 60 days (i.e., started taking vitals between April 2022 and December 2024). It analyzes patients’ first 14 days and last 14 days for their tenure in the Care Management at Home/Cadence program.
- The patient population included in the clinical outcomes section includes every patient with an ICD code related to the condition.
- Graphs include only patients who have completed the specified tenure period and had an average vital reading above the threshold mentioned during their first two weeks.
- Definitions: “Rural” as defined by the Health Resources & Services Administration and Federal Office of Rural Health Policy, https://data.hrsa.gov/tools/rural-health (see national listing of eligible counties and census tracts). “Underserved” as defined by the Federal Housing Finance Agency, https://www.fhfa.gov/DataTools/Downloads/Pages/Underserved-Areas-Data.aspx (low income areas, minority census tracts, and designated disaster areas).